
Traders,
NSE will be launching the most anticipated contract in the recent past for trading “Futures on India VIX” on February 26, 2014. We at Zerodha as usual, will be offering you trading on this new product for free until June 1, 2014. Following is our attempt to simplify trading on India VIX for you. I have taken the help of the NSE module on VIX, and from Akhil Bansal. who specializes in volatility based products, a B.Tech from IIT Delhi, an MBA from Richard Ivey, and Founder-CEO at Indianvolatility.com.
Open low brokerage trading account
Introduction
“VIX” is a trademark of Chicago Board Options Exchange (CBOE). CBOE was the first exchange in the world to compute a volatility index back in 1993. The derivative (F&O) trading on VIX started in 2004 on CBOE and its popularity has grown immensely over the years. With the increasing popularity of option trading in India, and since India VIX is designed similar to the CBOE VIX, we should be seeing a similar trend in trading activity on the India VIX contracts in the coming years. .

Popularity of CBOE VIX Contracts
What is India VIX
India VIX is a volatility index based on the index option prices of Nifty. It is computed by using the best bid and ask quotes of the out of the money, present and near month Nifty option contracts. VIX is designed to indicate investors’ perception of the annual market volatility over the next 30 calendar days, higher the India VIX, higher the expected volatility and vice-versa.
We will not get into the complex mathematical formula used to calculate the India VIX, but here is how you interpret VIX.
For example, if India VIX is 16.8025, this represents an expected annual change of 16.8025% in the Nifty over the next 30 days. That is, you expect the value of Nifty to be in a range between +16% and -16% from the present price of Nifty for the next 1 year for the next 30 days. So if Nifty is presently at 6000 the expected range of Nifty for 1 year is between 5000 and 7000.
If you want to calculate expected volatility for the near term using the VIX, say a month then formula to use is (VIX/Sqrt (T)) %
- If you want to know what is the expected monthly volatility of Nifty based on VIX of 16.8025, you should divide 16.8025 by square root of 12 (T = 12, 12 30 day terms in 1 year). So the expected volatility of Nifty using VIX for the next 1 month = 16.8025/3.464 = 4.85%
- This information of expected monthly range of Nifty can be used by people who trade Nifty options as well, especially the option writers. For example, shorting options above or below the expected monthly range of the Nifty.
Free Demat Trading Account Open
Movement of India VIX
Historical data for India VIX is available from Mar 02, 2009 even though the futures trading starts only on Feb 26, 2014. Find below India VIX plotted against the NIFTY for the last 4 years.
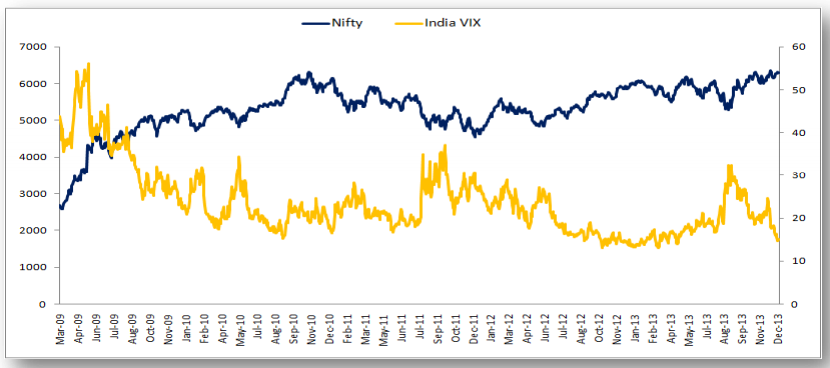
NIFTY vs India VIX
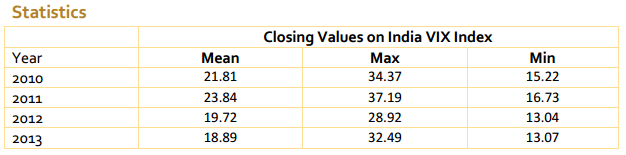
Yearly Range of VIX for last 4 years
We can now infer:
- A negative correlation between India VIX and Nifty, VIX tends to drop when Nifty goes up, and vice versa.
- India VIX at high levels implies a market expectation of large movement in Nifty and vice versa.
- Range of India VIX for the last 4 years has been in between 13 to 35 as shown in the table above. Yes, VIX had spiked to 50+ levels in 2009 when we had 2 upward circuits moves on the day election results were announced, but otherwise the range has been between 13 and 35. Looking at the past 4-year data, we can say that VIX is considered high if it is above 25 and low if it is below 15, so the normal range is considered between 15 and 25.
Trading India VIX
India VIX is an index, and very similar to Nifty, you cannot really trade an index unless you have derivative (F&O) contracts on them. With the introduction of India VIX futures, we can use the India VIX to hedge the volatility risk to our portfolio and/or use it to speculate.
The future contract on India VIX
- Lot size: Yet to be announced.
- Symbol: INDIAVIX
- Tick size: India VIX will be calculated up to 4 decimals with a tick size of Rs 0.0025 (for example, India VIX today is 17.0025)
- Quotation price: India VIX * 100 (multiples of 100). If a trader wants to buy or sell contracts of India VIX futures at 18.1475, then the price that shall be be quoted would be Rs.1814.75. (My guess is that the lot size would be around 600, as the suggested contract value is around Rs 10 lakhs)
- Trading hours: 9.15 AM to 3.30 PM
- Expiry Day: Tuesday (Every Week)
- Contract Cycle: 3 weekly contracts
- Final Settlement price: Closing Price of the underlying India VIX index
- Final Settlement procedure: Cash
- Margin: Initial Margin of 9% + Exposure Margin of 5% = 14% of the contract value (should be around Rs 1.5lks)
Here are some of the ways of using the India VIX futures
- You have a stock portfolio and are worried about markets going down, or volatility increasing : buy India VIX futures.
- You see that India VIX is at the top end of the 4 year range (around 35), and you speculate that it is going to go lower : you can short India VIX futures.
- Elections are around the corner, and you find the India VIX at around 20 and expect the volatility in the market to pick up : you can buy India VIX futures.
Using India VIX instead of Options
From the Black-Scholes model we know that options price increases with increase in volatility and decreases with a fall in volatility if everything else remains same. Currently, the only way to trade volatility is by buying or selling options (calls or puts as may be the directional bias of the market). Downside of this approach is that in the real world all other things like time decay (theta factor), stock price (delta factor) do not remain constant while volatility is moving. So it becomes hard for a trader to purely trade the volatility with options. Using the India VIX such a volatility trader will be a able to trade much more efficiently.
Technical Analysis and India VIX
If you look at the India VIX historical data, it is an easy observation that it is not a trending data series but rather an oscillating data series (range has stayed between 13 and 35). Since the India VIX doesn’t trend after a certain point, but rather oscillates in a range, we shouldn’t use trending indicators like moving averages, but rather use oscillators. One such good oscillator to use would be Bollinger Bands. See the chart below for India VIX, and how India VIX has reversed most of the times it has touched either the upper or lower end of the 20 – day Bollinger Band.
100% Free Trading Account Open
If you are a technical analyst, you can use other similar oscillators for predicting the move of the India VIX
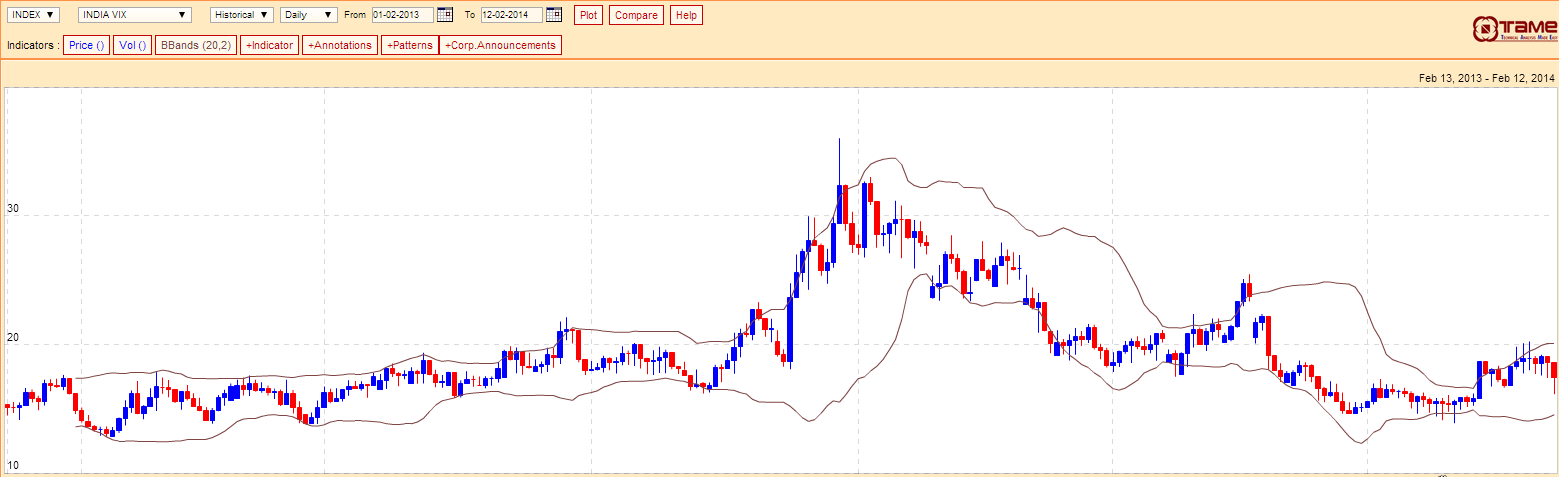
India VIX and Bollinger Bands
(Source : www.Zerodha.com)


